
Remote Sensing Projects
Mapping Annual Deforestation in Madagascar
This research attempts to bridge that gap and compute annual forest cover change over time from 2015 to 2019 using an automated land cover mapping method. Land cover maps are most commonly created through the classification of remotely sensed images which can be easily computed on a cloud-based platform like GEE, Google Earth Engine. Availability of relevant imagery data on the platform itself and ability to analyze data allows for an automated and repeatable workflow. Spectral, and extracted features derived from Landsat 8 imagery, along with environmental variables (DEM, soil type) are used as inputs into the classification model. The generated classification maps were then compared to compute annual forest change.
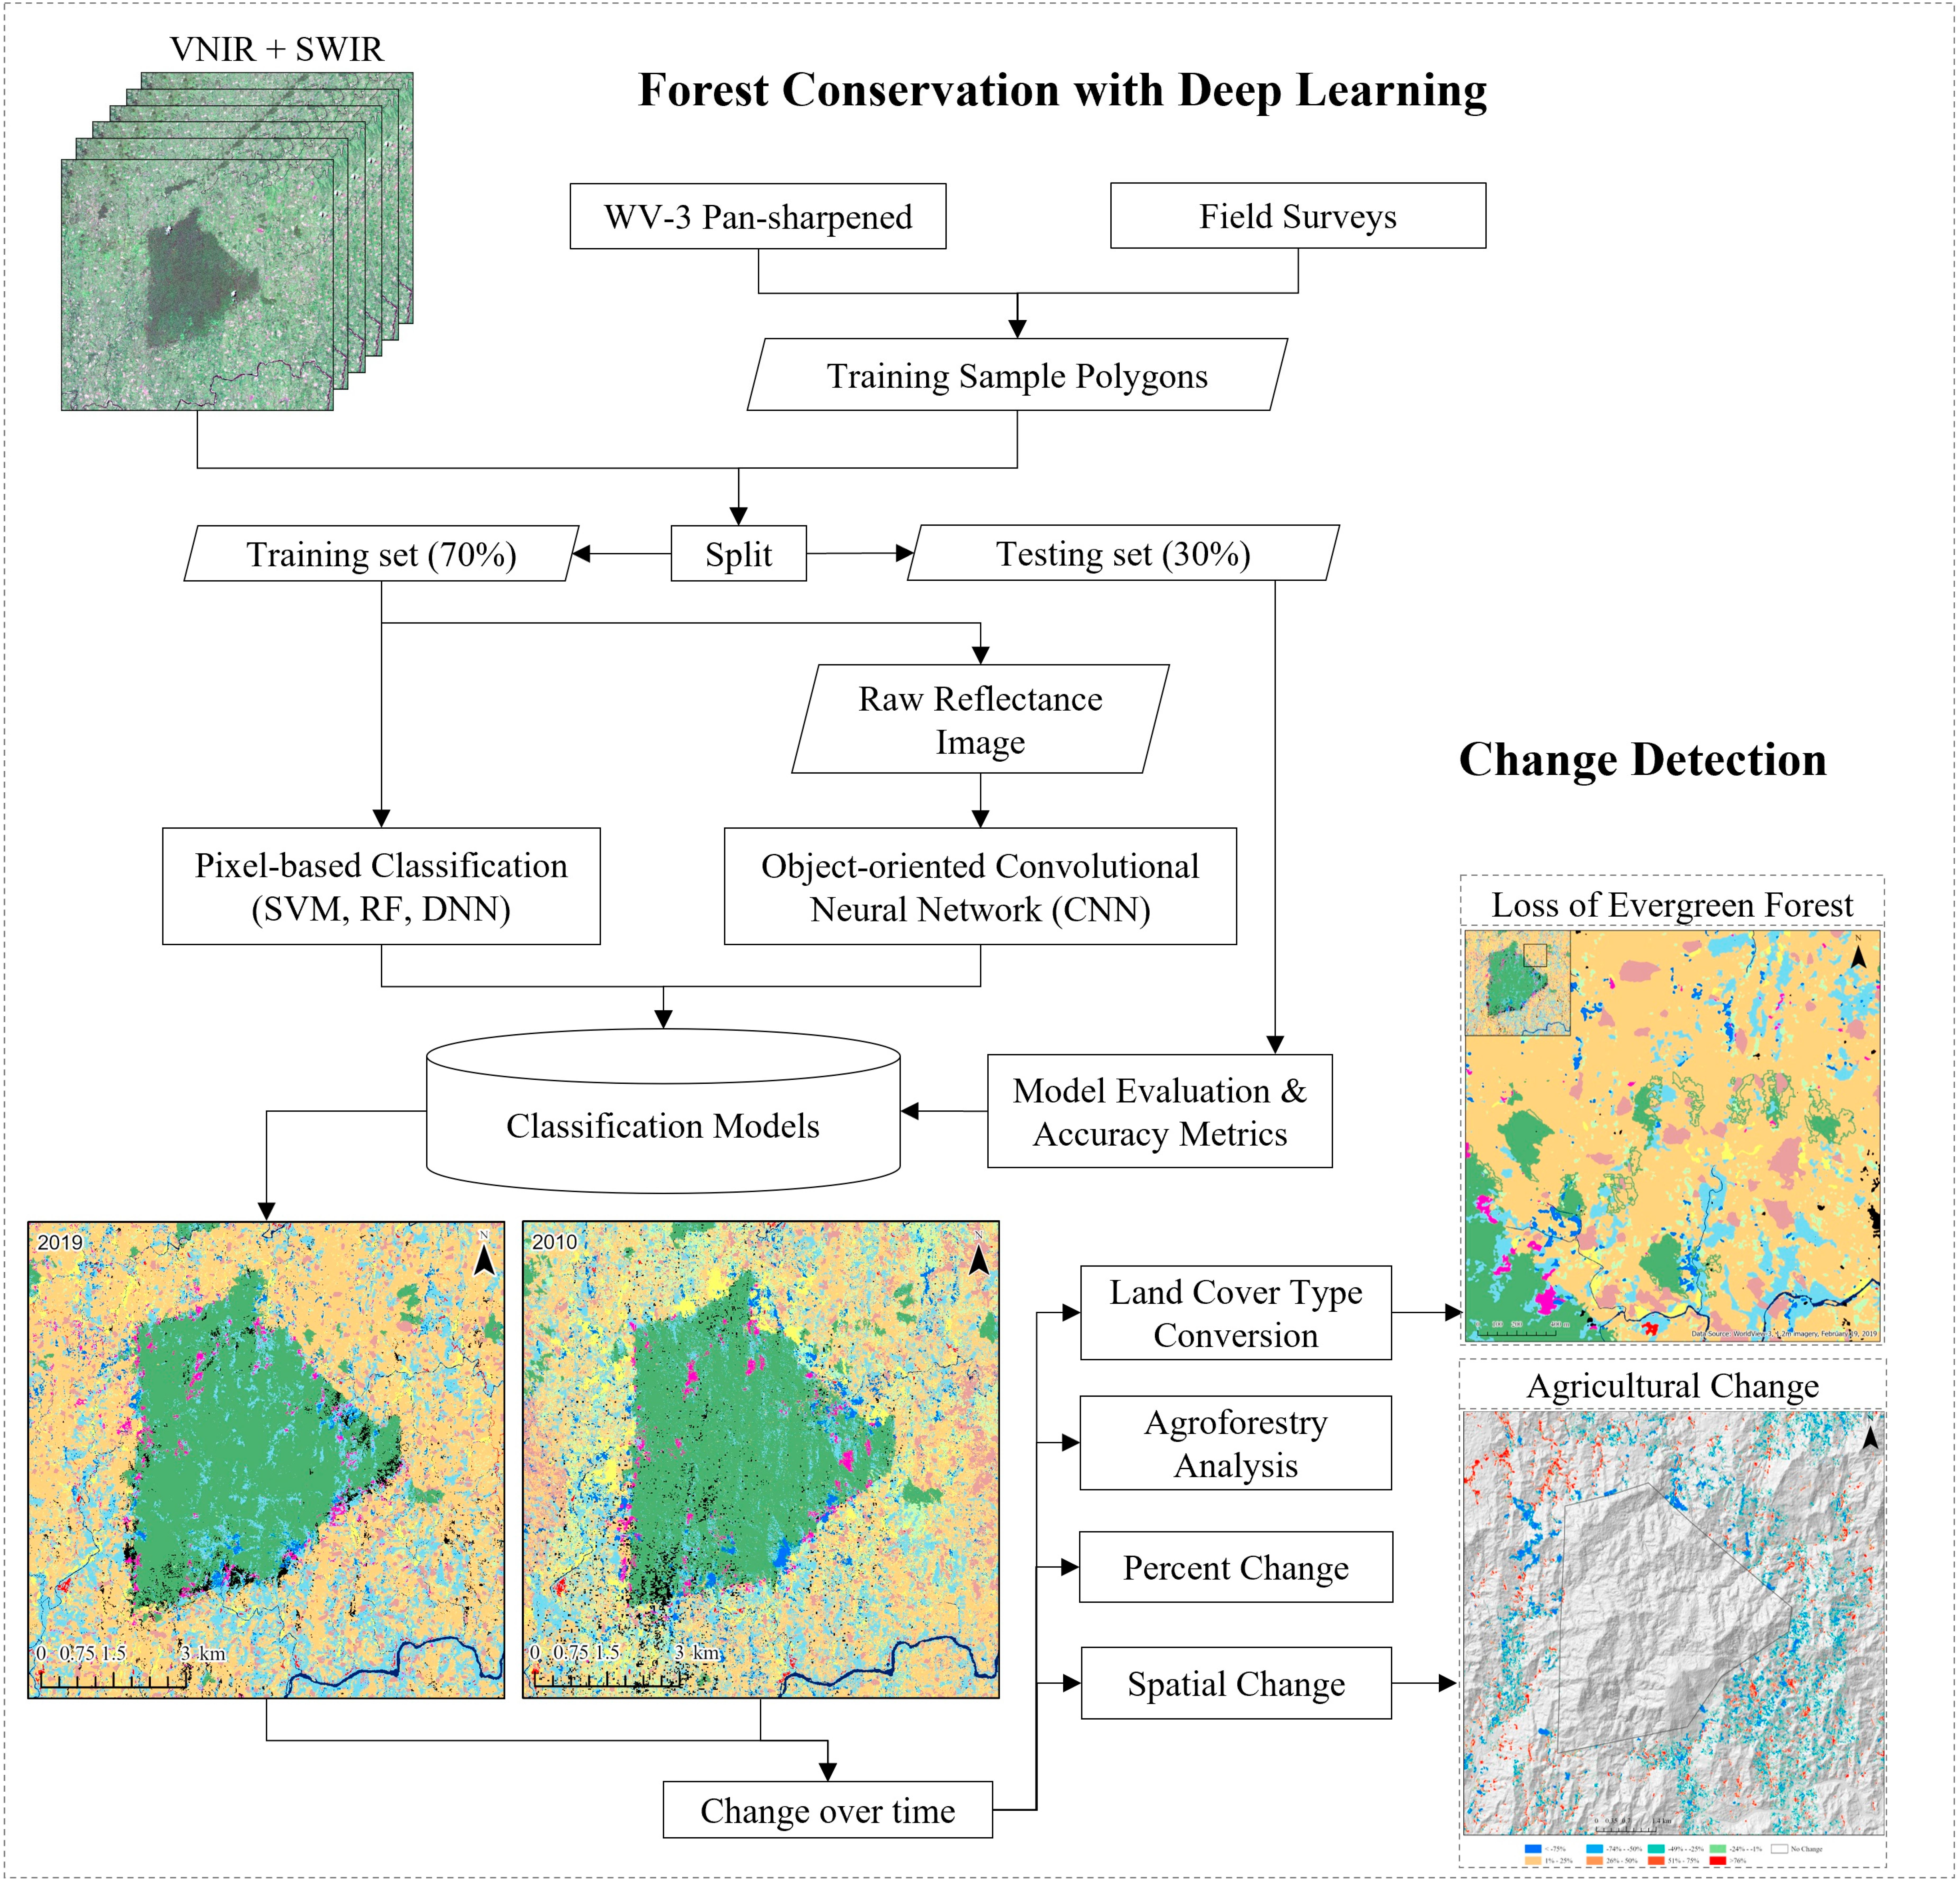
Forest Conservation with Deep Learning
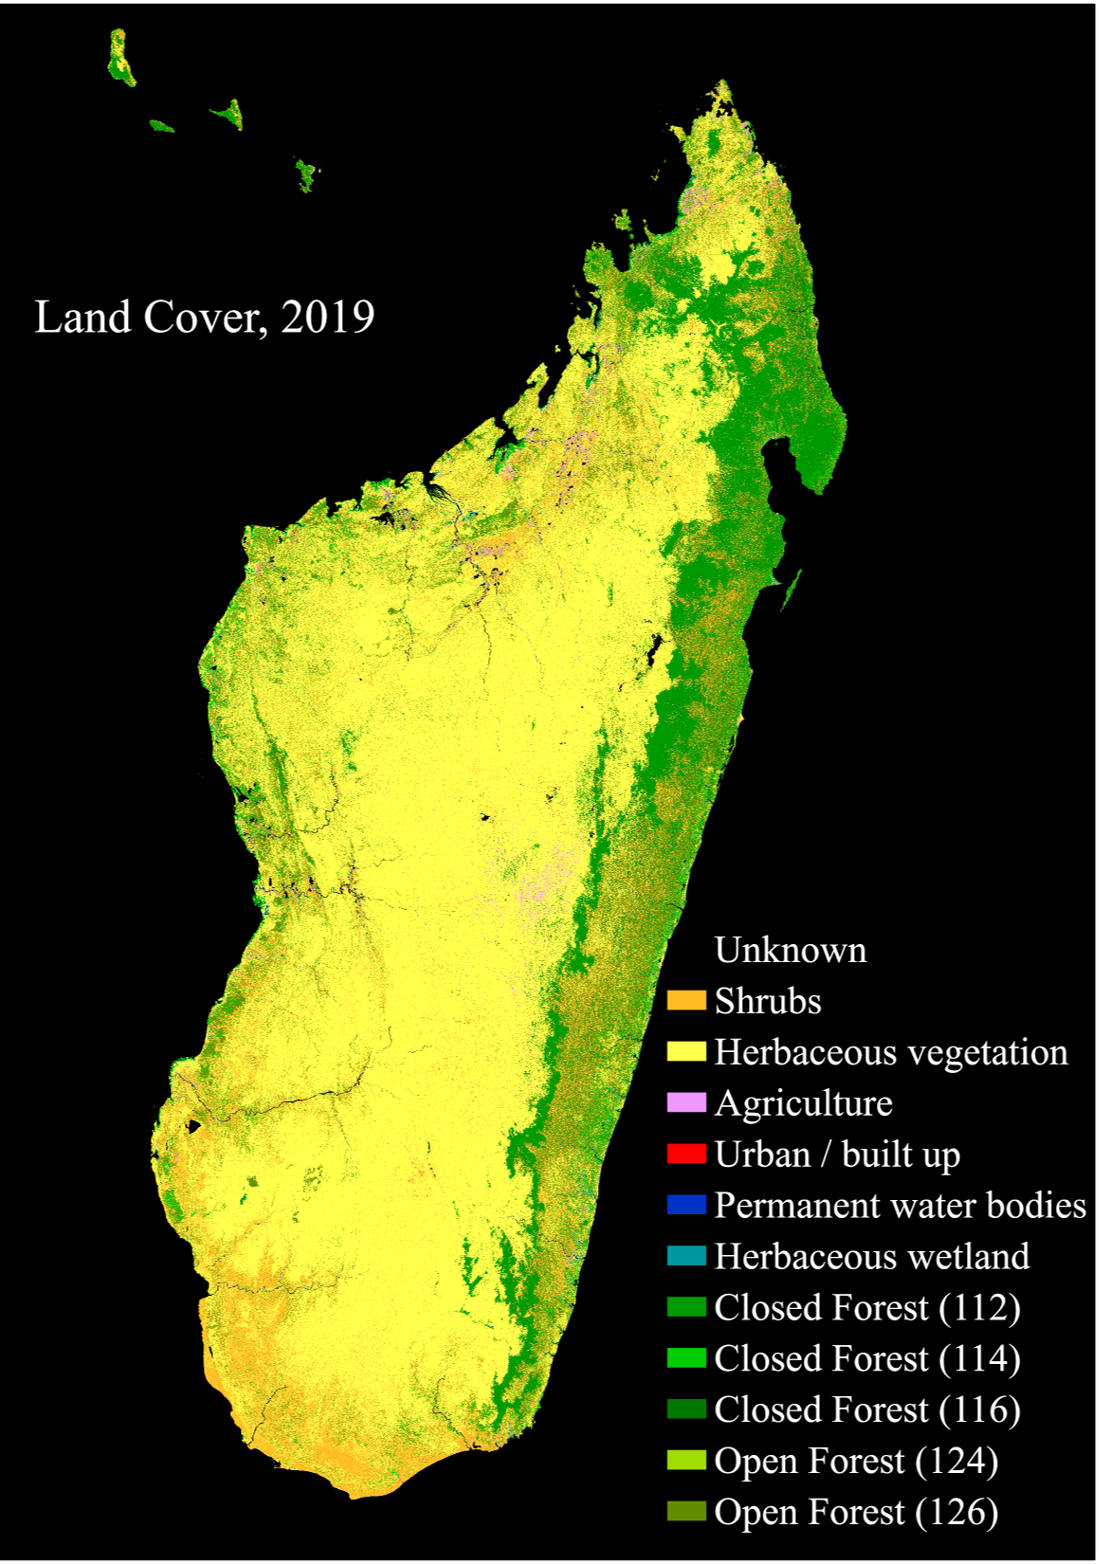
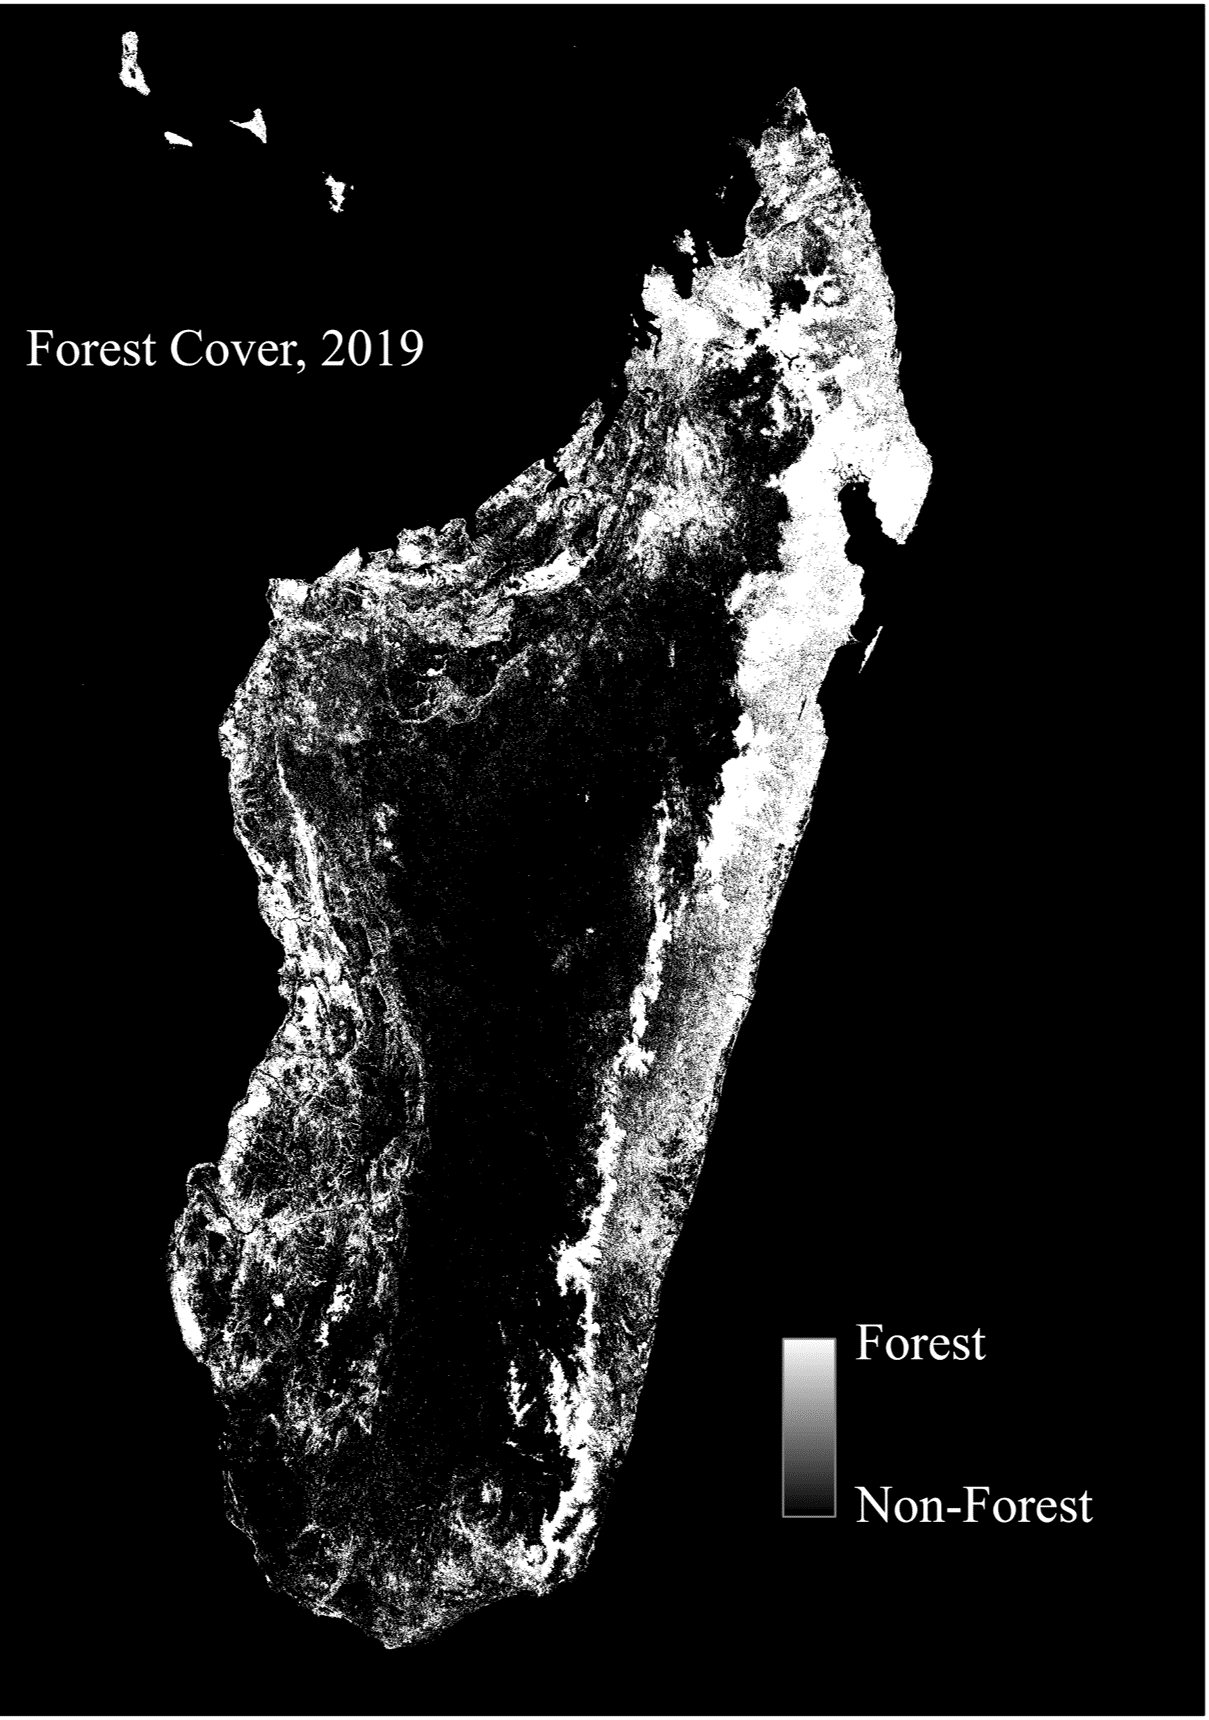
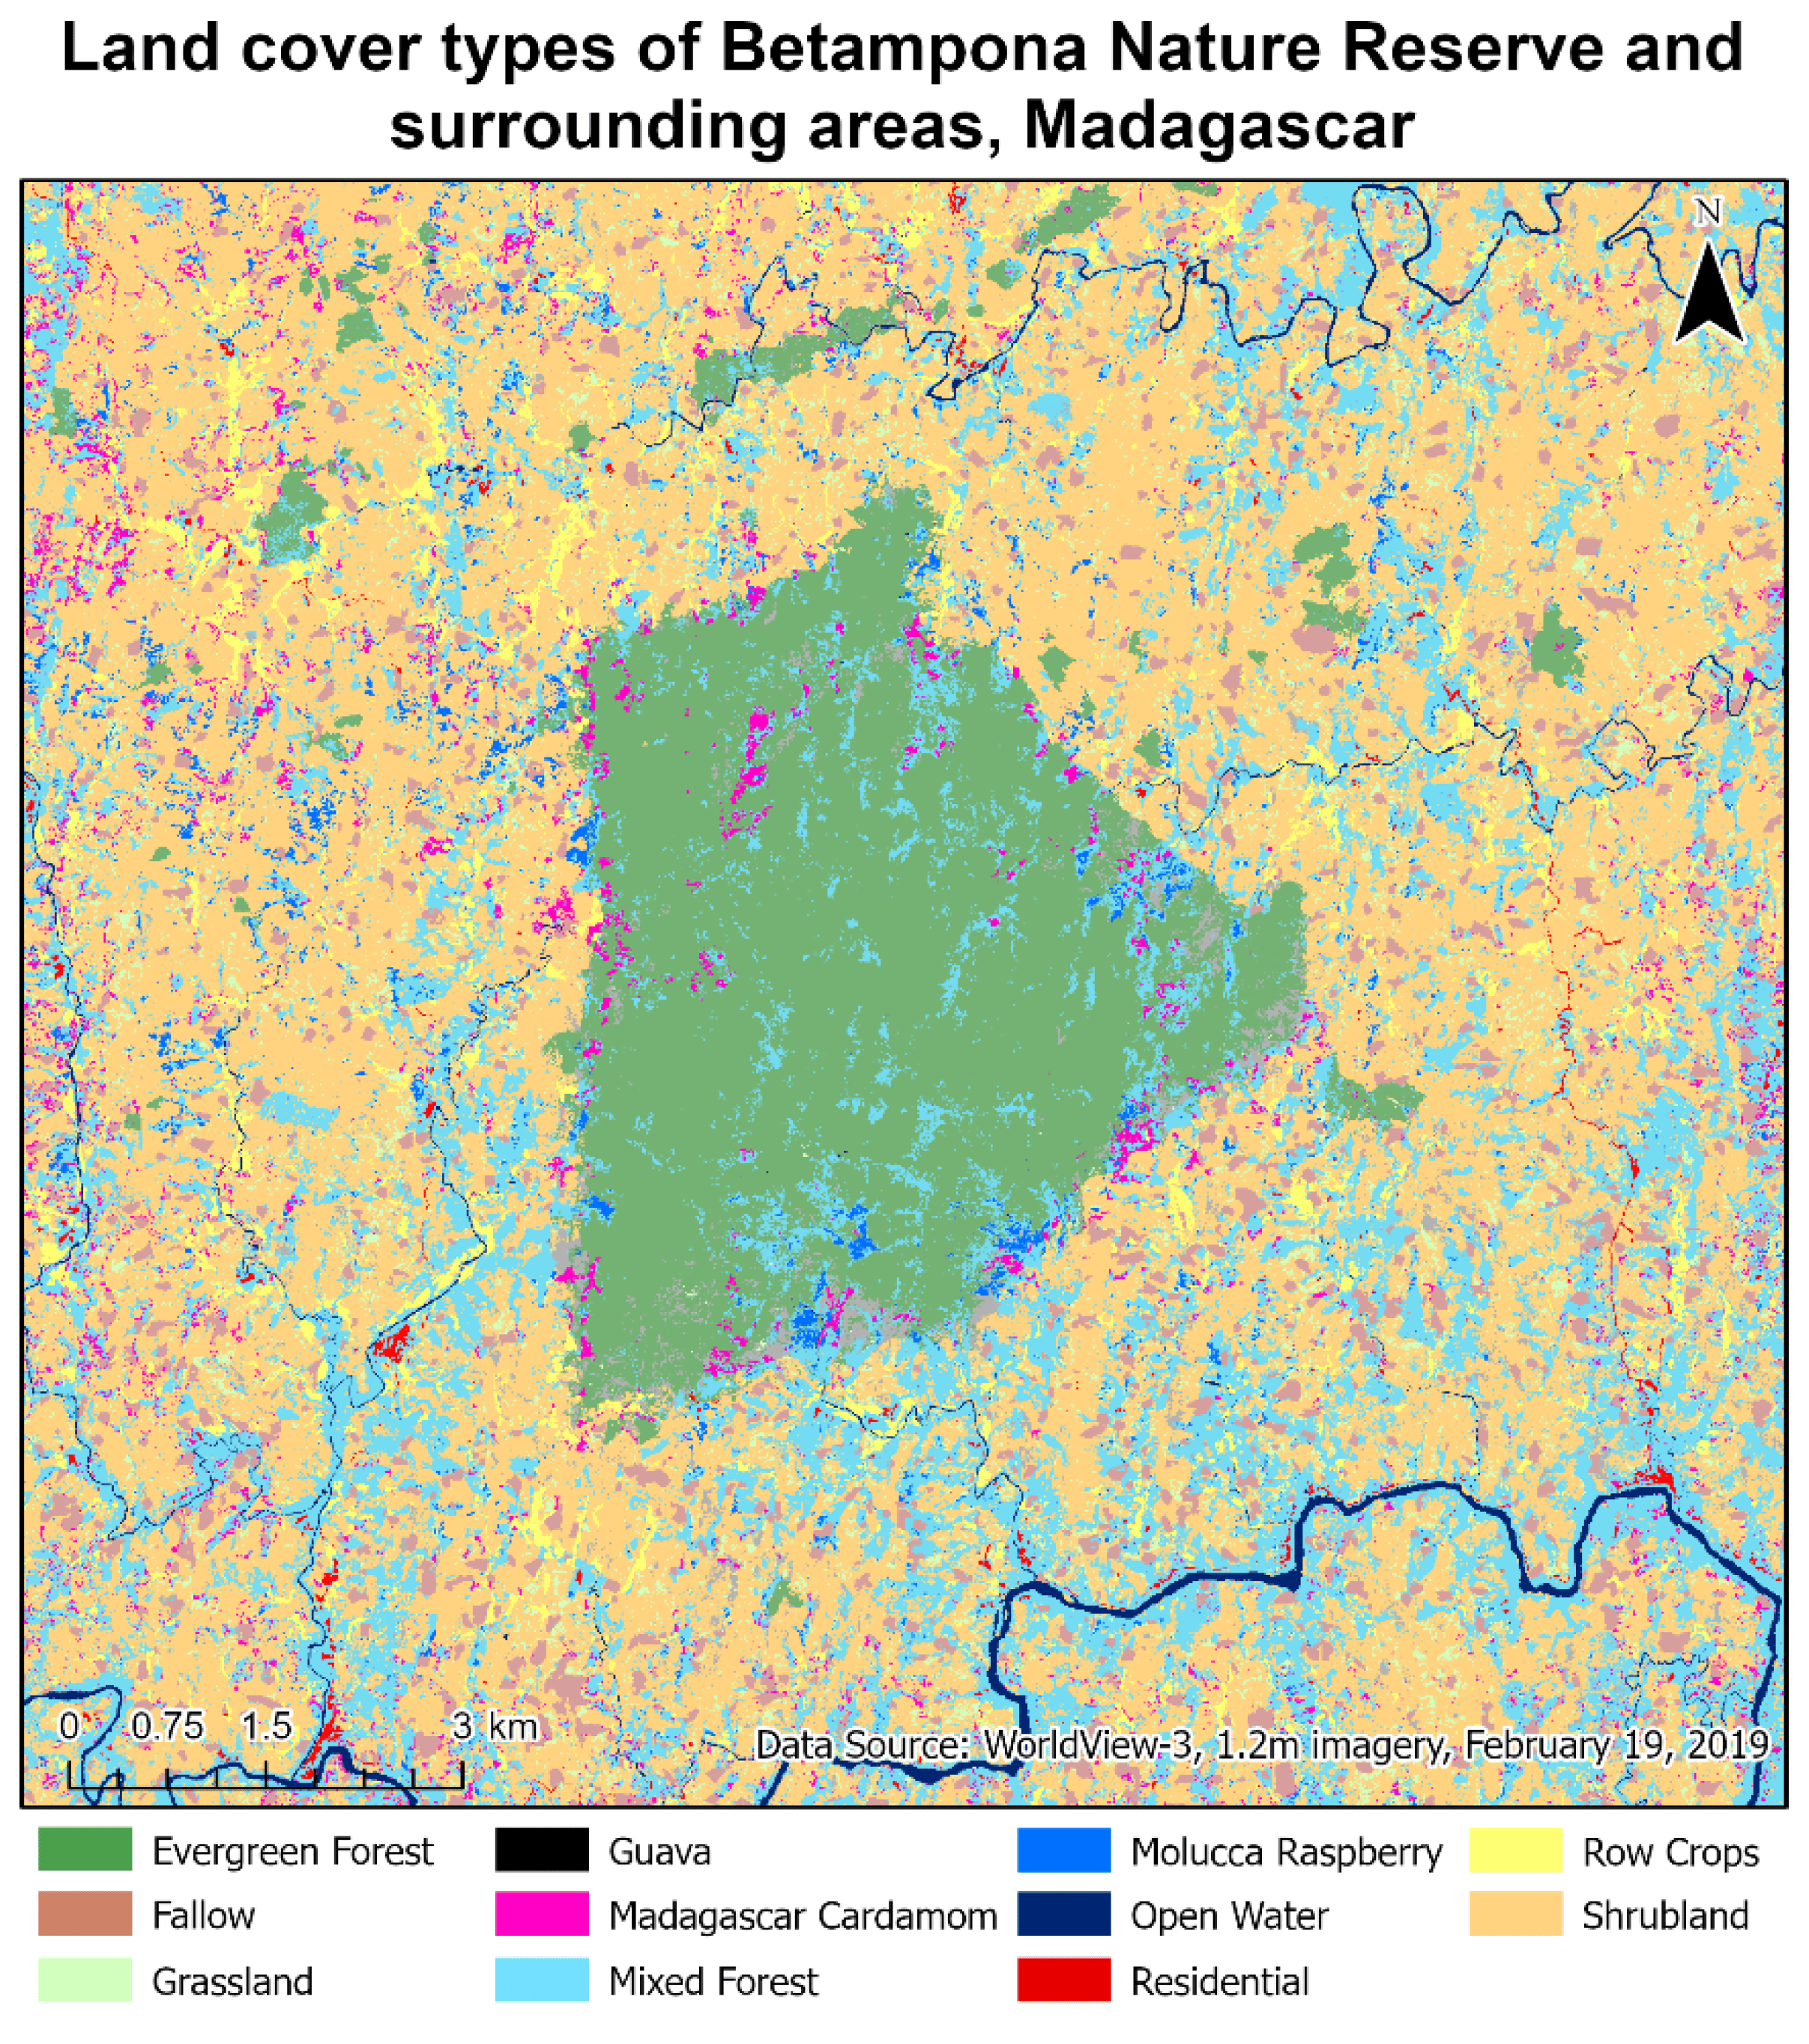
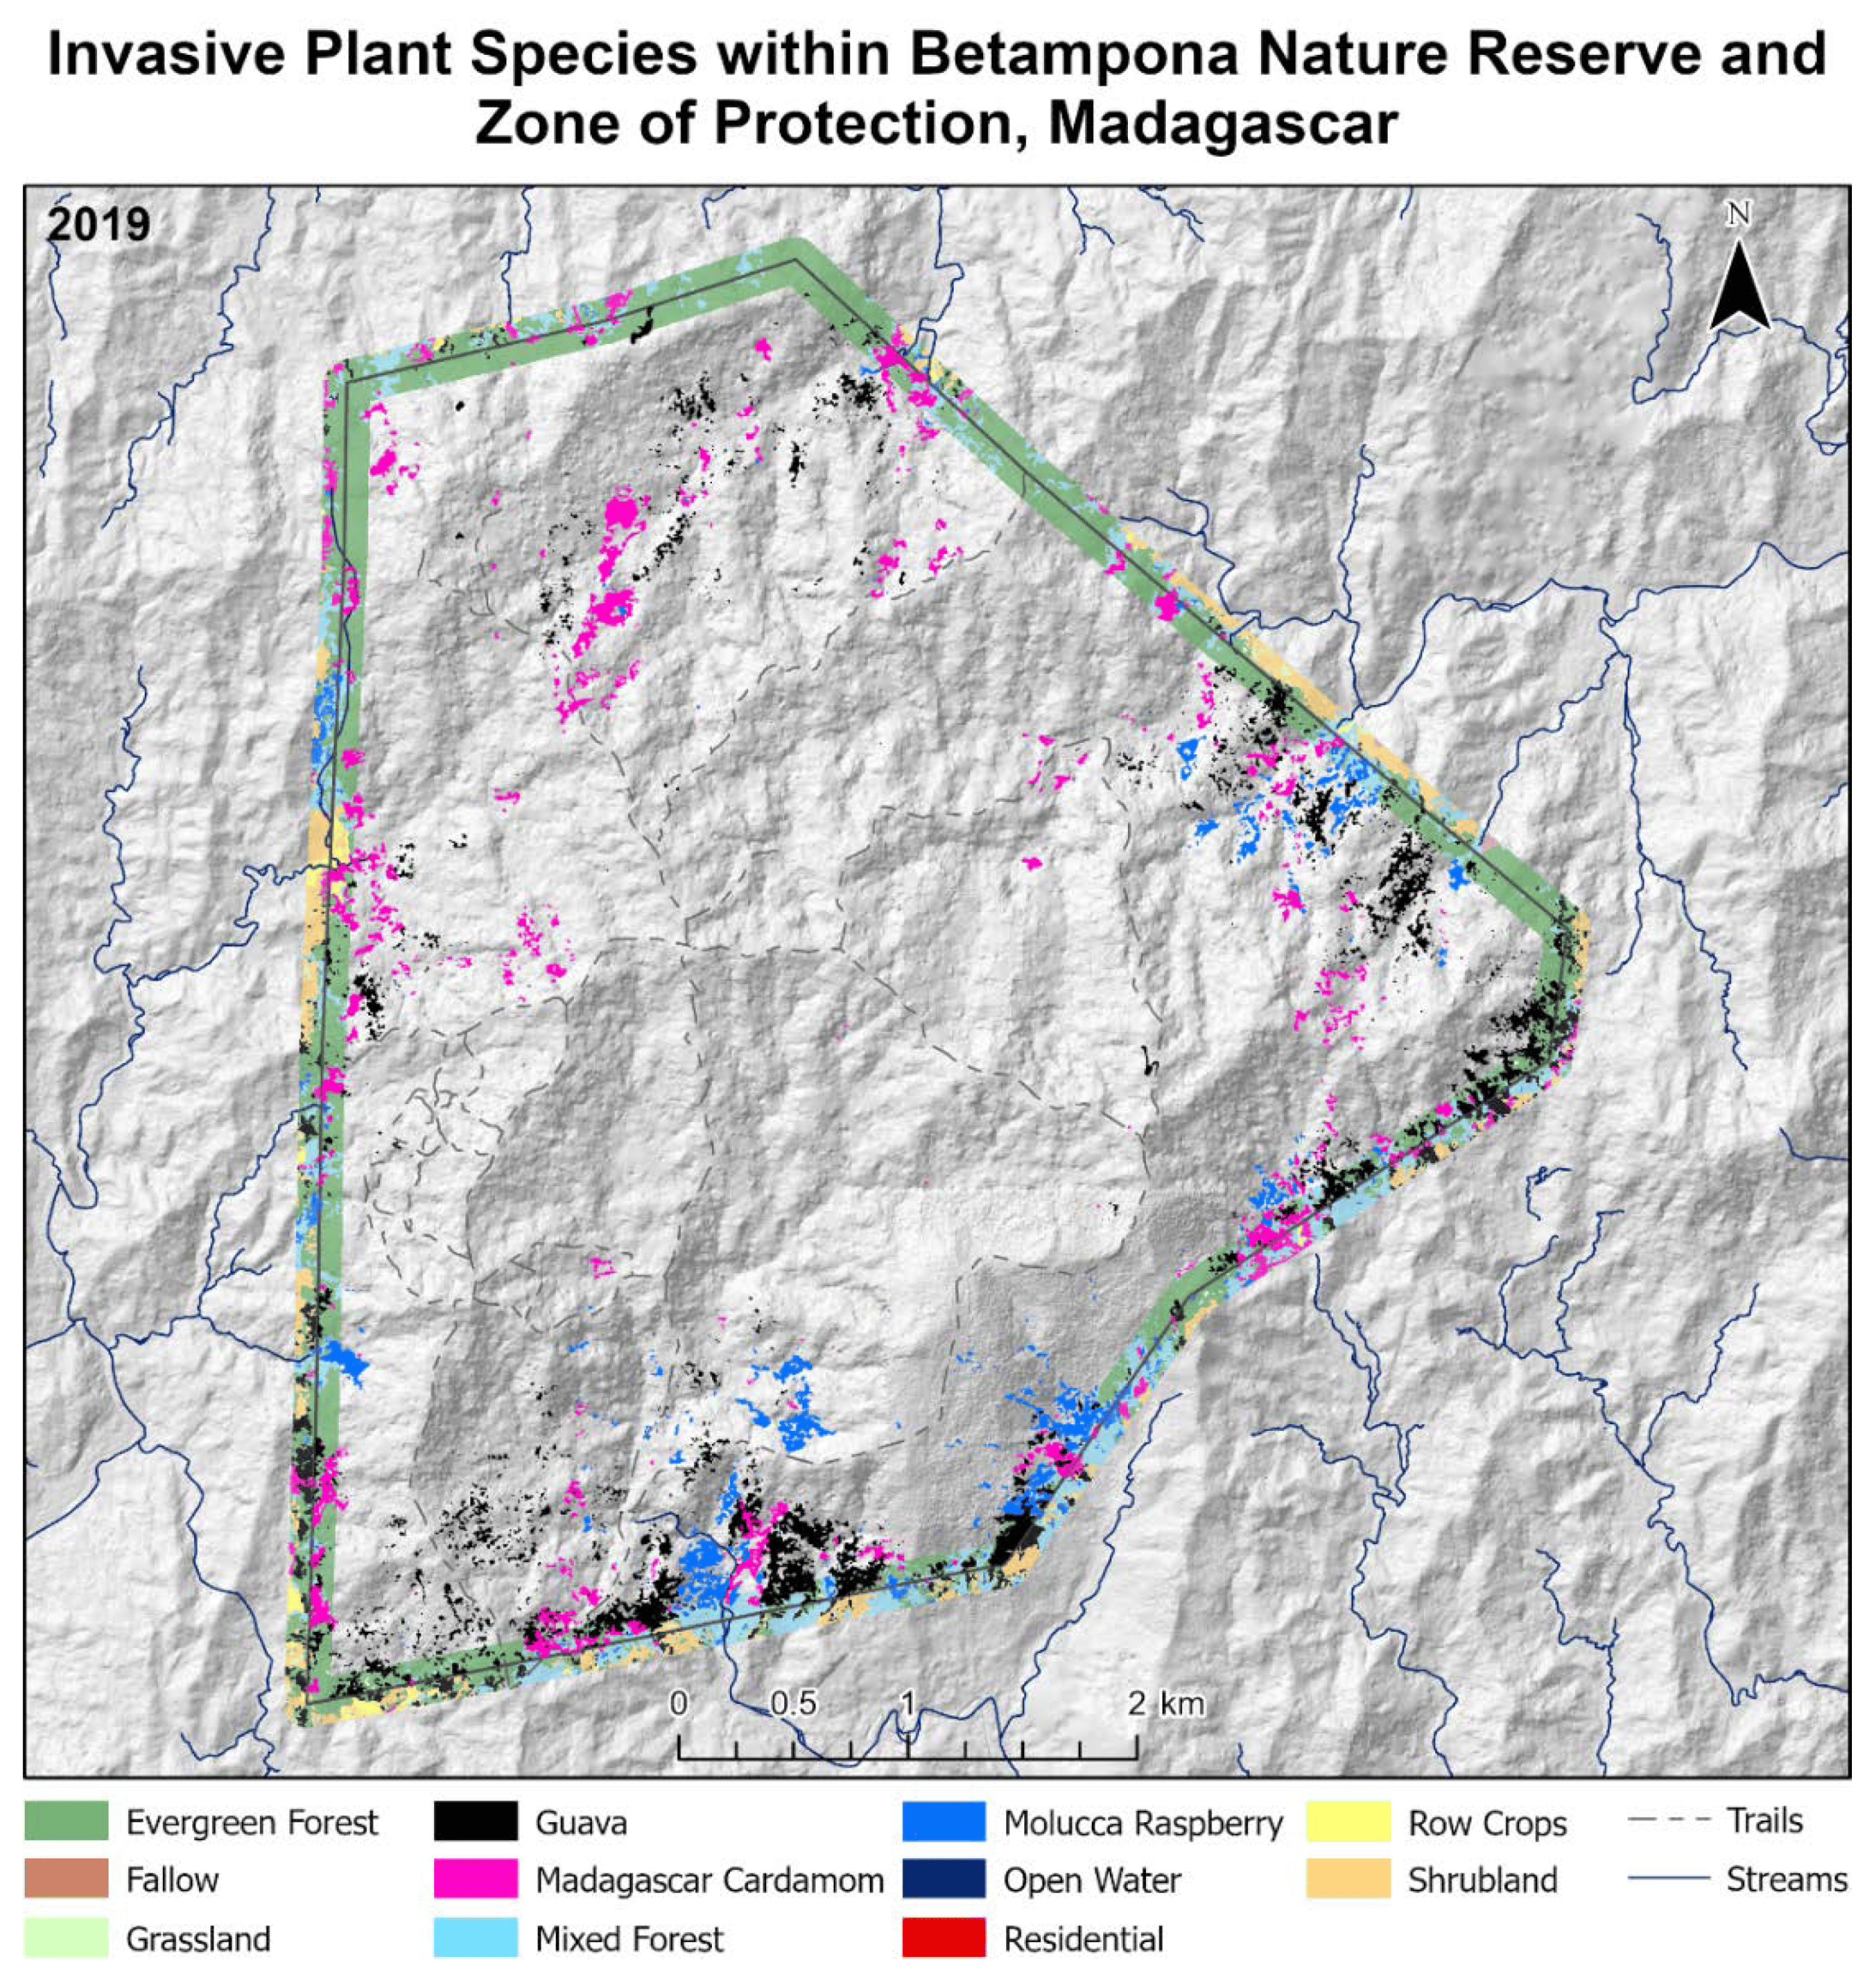
This research involved creating a land use land cover map for Betampona Nature Reserve in Madagascar. The objectives were to develop an end-to-end mapping of the tropical forest using fully convolution neural networks (FCNNs) using WorldView-3 (WV-3) imagery and secondly to quanify the human impact on the environment. The FCNN (U-Net) model which used spatial/textural information was compared with pixel-based methods including Support Vector Machine (SVM), Random Forest (RF), and Deep Neural Network (DNN). Spatiotemporal analysis was also conducted using the results of this research and a previously generated land use land cover map. This analysis showed a 0.7% increase in Evergreen Forest within the BNR and a 32% increase in tree cover within residential areas likely due to forest regeneration and conservation efforts.
Read the published research or interact with the Story Map to learn more.
Missouri as Art
Similar to the Earth as Art image collection, the below images were created for various locations in Missouri.
The below False Color Images (FCC) are created by displaying any bands other than the Red, Green and Blue in the respective red, green and blue channels of the computer. By displaying bands other than the visible, we can see the unseen. False Color images are used to highlight certain features; for example, the combination (NIR, R, G) highlights vegetation in shades of red.
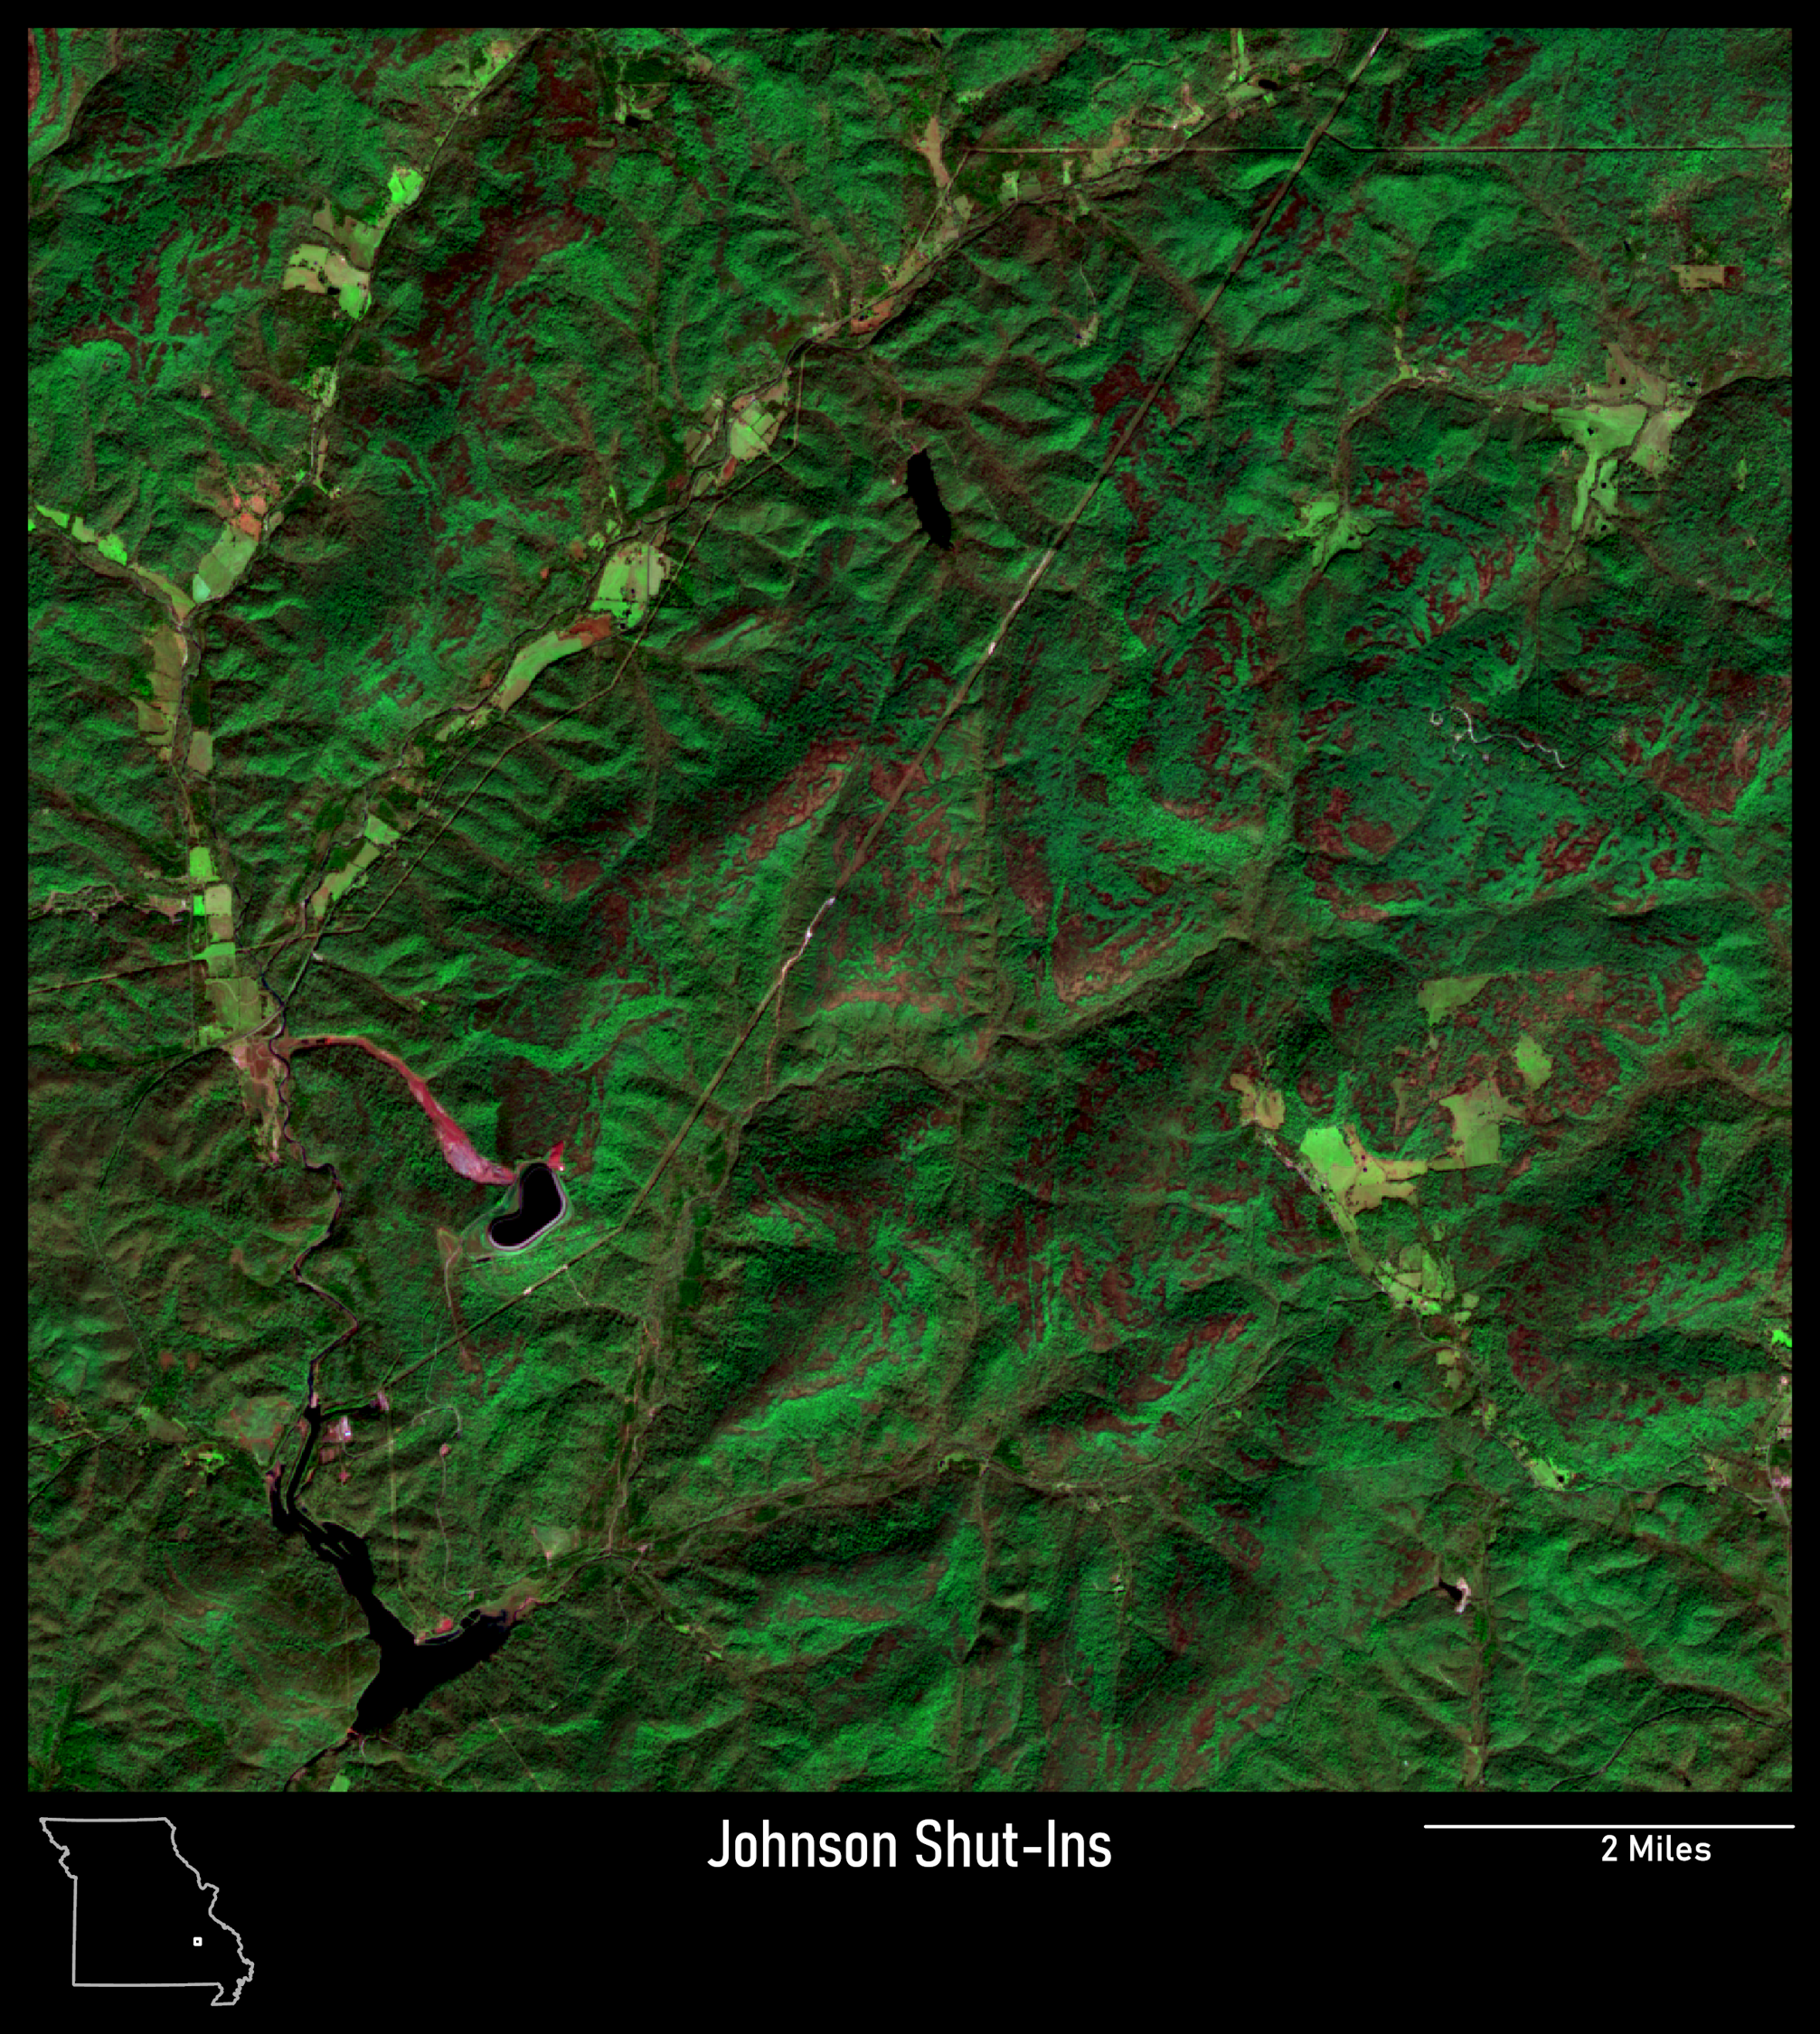
This band combination highlights undulating terrain in south-eastern Missouri. Vegetation is seen in green because of the high reflectance in NIR (Near Infrared), exposed rocks are colored red due to SWIR 2 (Shortwave Infrared) bands. Finally, exposed sediments are in shades of pink due to SWIR 2 and Red Edge 1.
Sentinel-2: SWIR 2, NIR, Red Edge 1 (B12, B8, B5)
Date Acquired: October 22nd, 2015
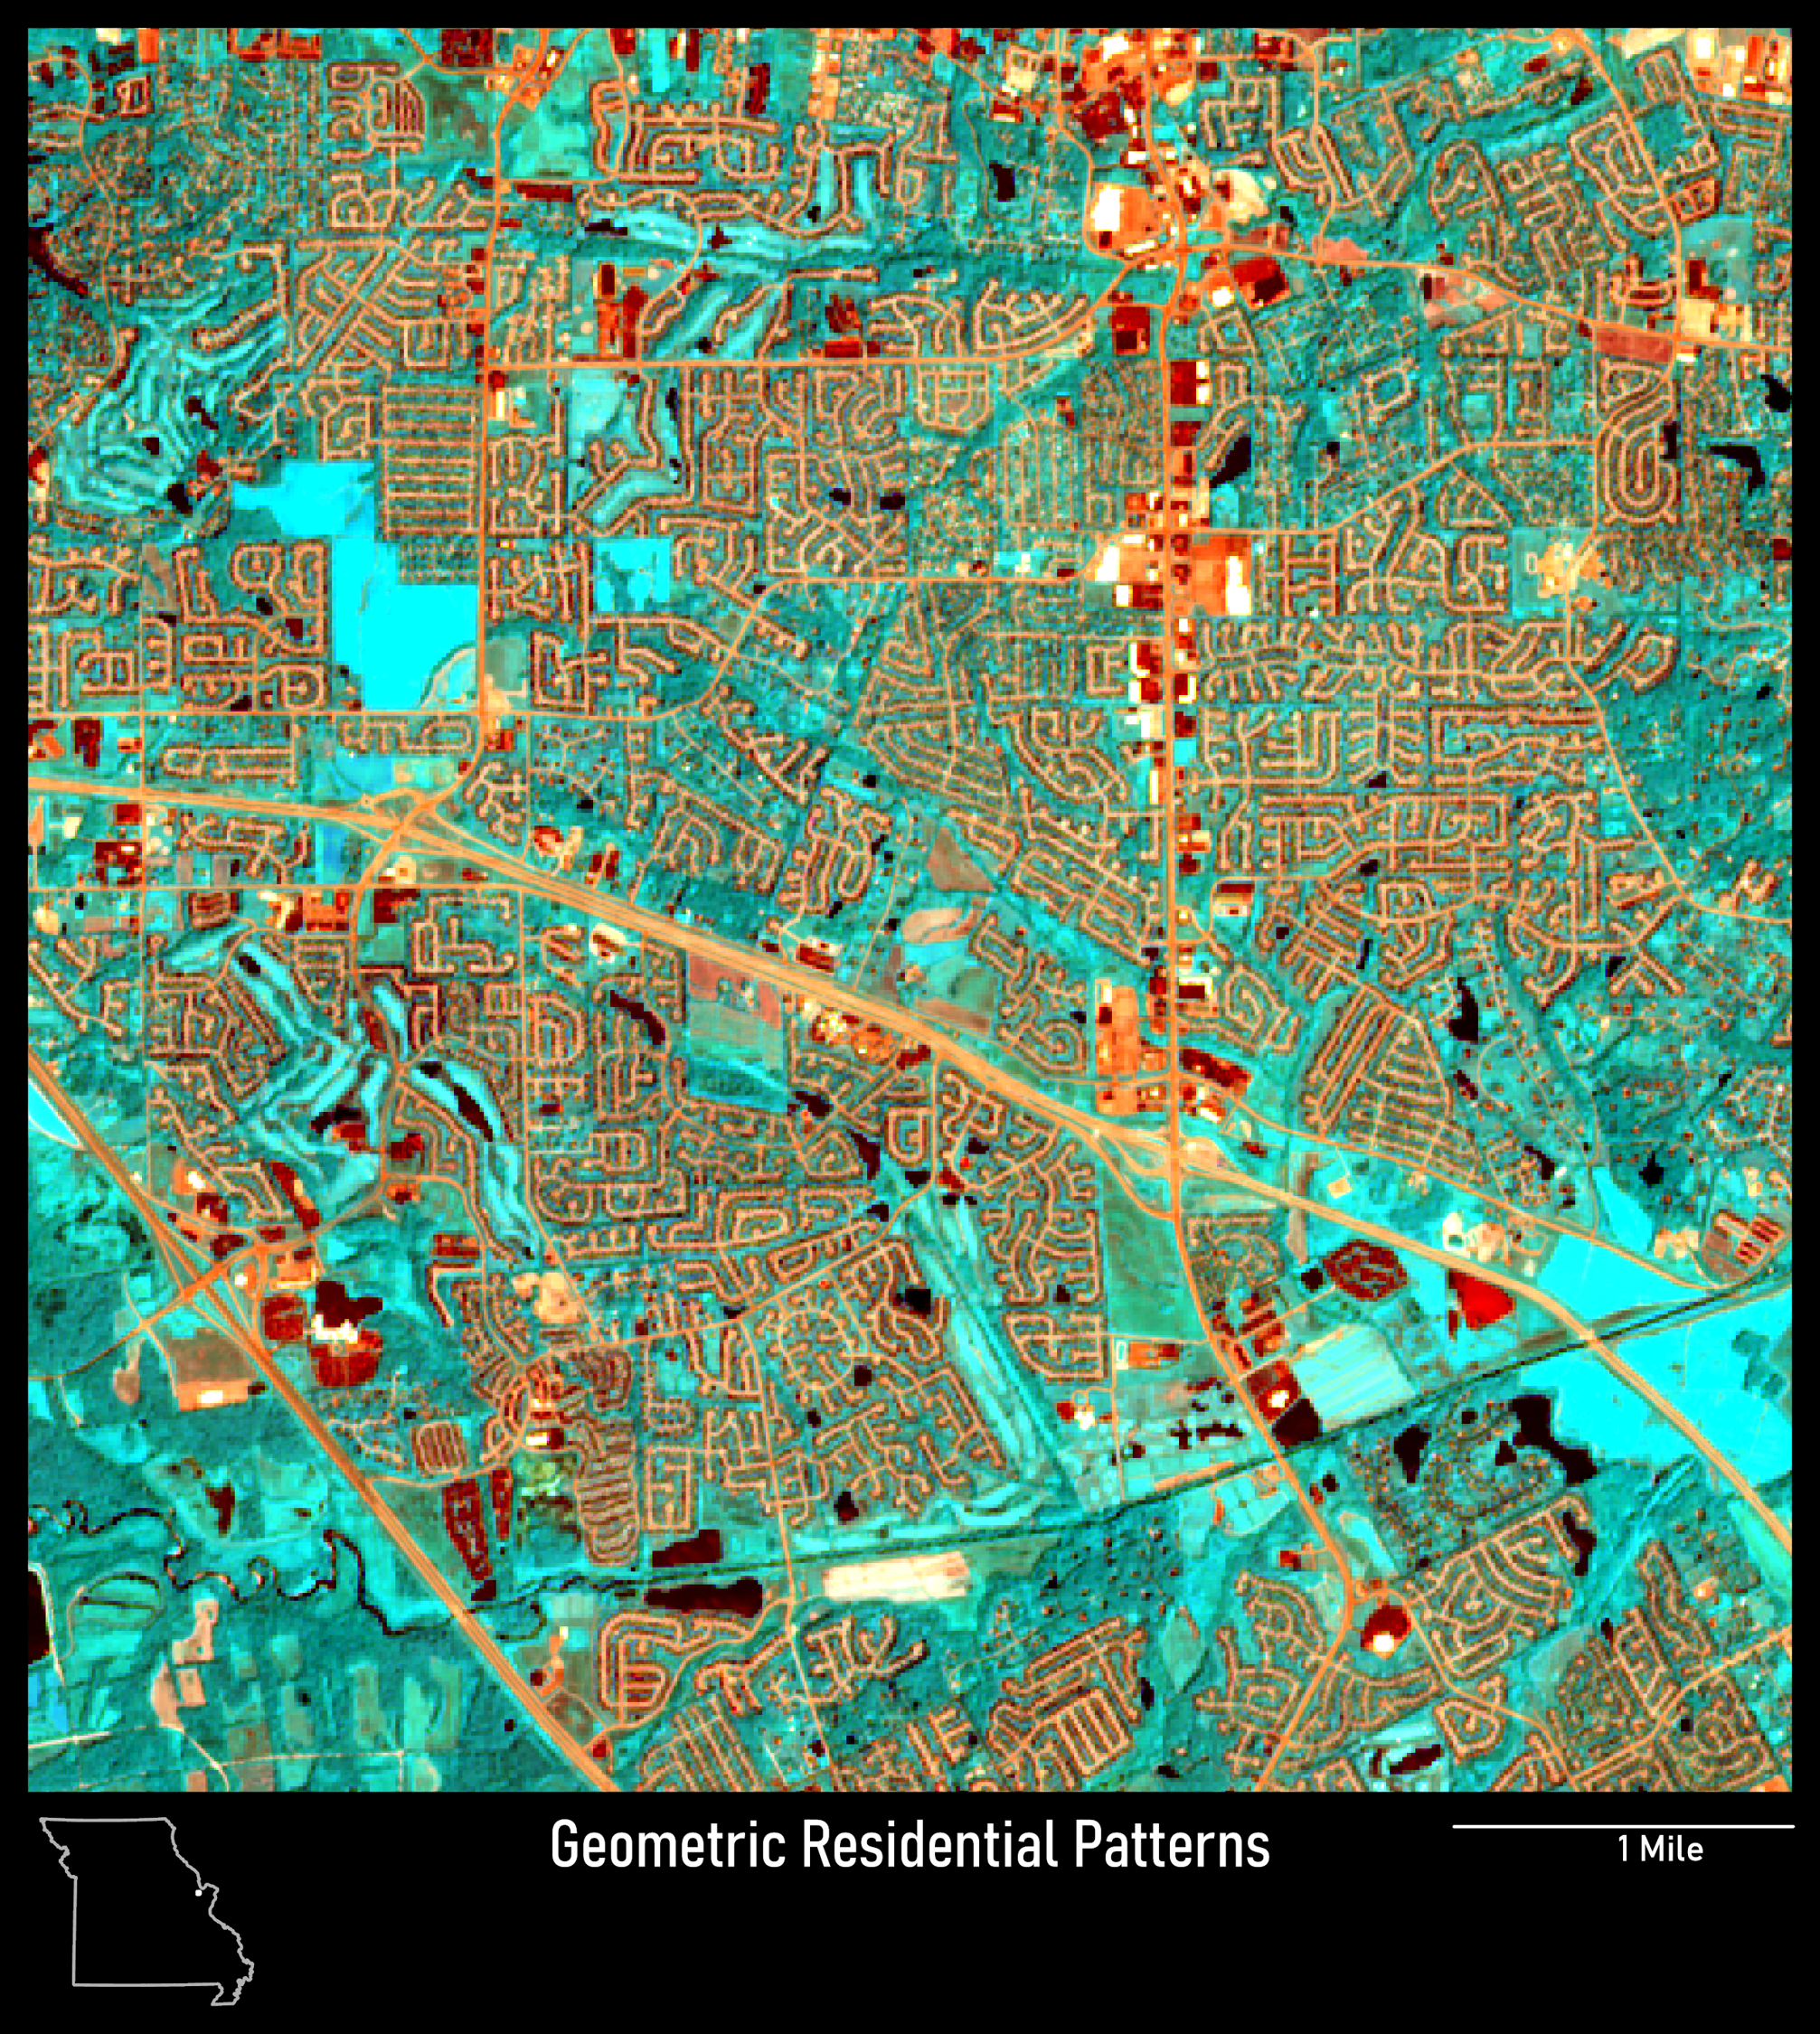
This band combination highlights patterns observed in a residential cul-de-sac in O’Fallon, Saint Charles county. The paved roads and concrete structures have a high reflectance in Red and Red Edge 2 resulting in the orange color. Vegetation has a high reflectance in the NIR (Near Infrared) and thus appears in shades of blue.
Sentinel-2: Red, Red Edge 2, NIR (B4, B6, B8)
Date Acquired: May 20th, 2016
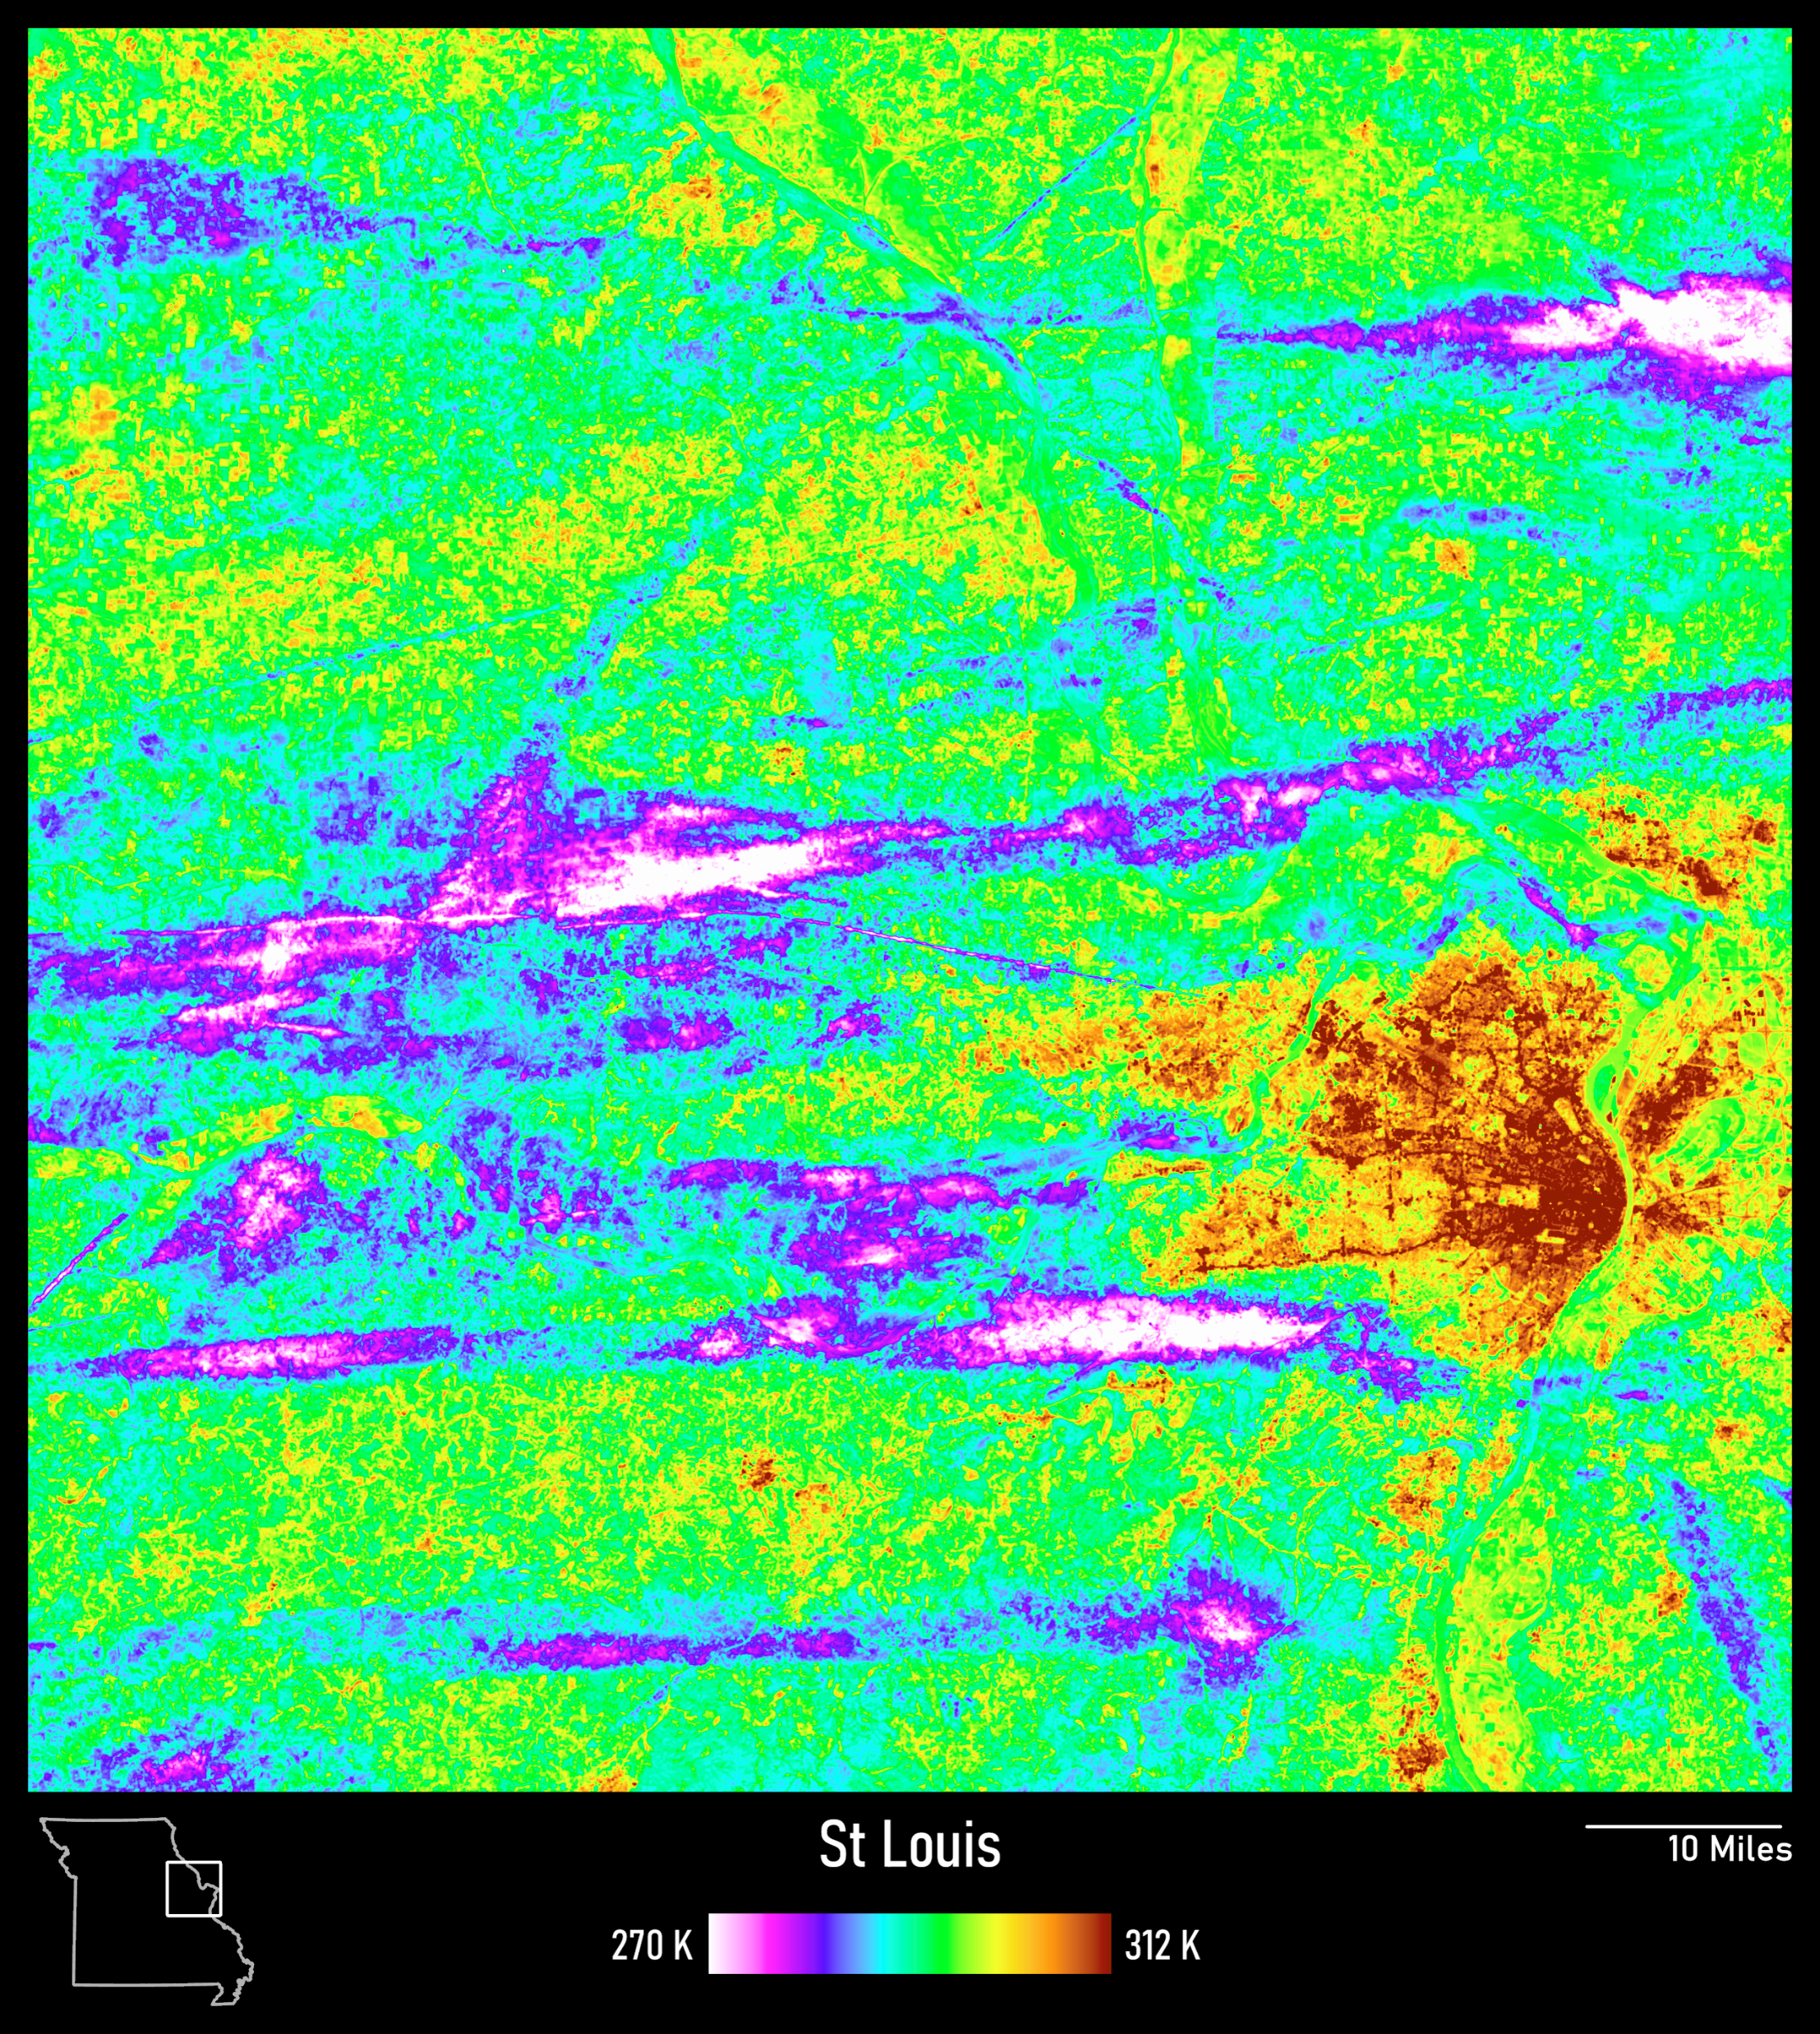
This image is not a false color composite, as it was created using a single TIR1 band (band 10) from Sentinel-2 data. A color scheme is used to display the at-surface brightness temperature. The urban concrete areas in the city have a higher surface temperature, while Forest Park and other larger parks have a comparatively lower tempwerature, a good visualization of the importance of green spaces in our urban environments. This image also captured the cooler clouds.
To see more images created as part of this series, click here.
*last updated in 2024